Fresno, CA Pollen and Allergy Report for Summer 2023

Pollen Allergy Trends in Fresno, CA
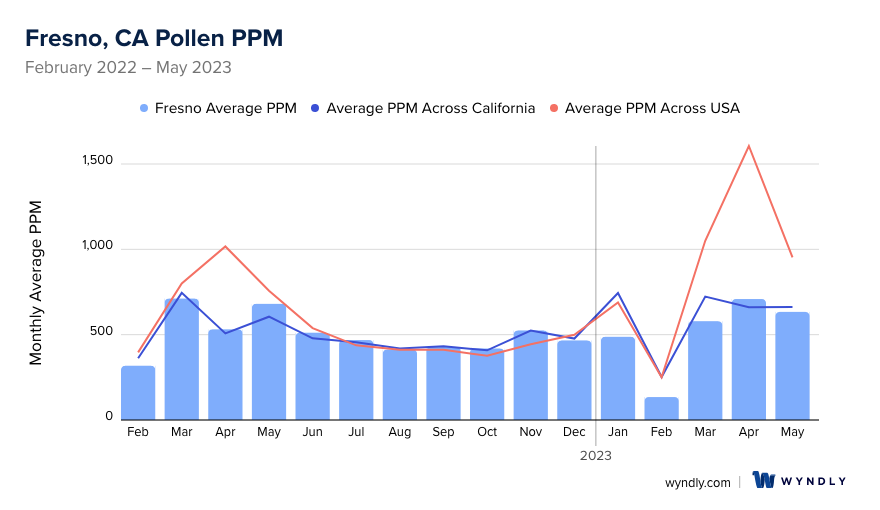
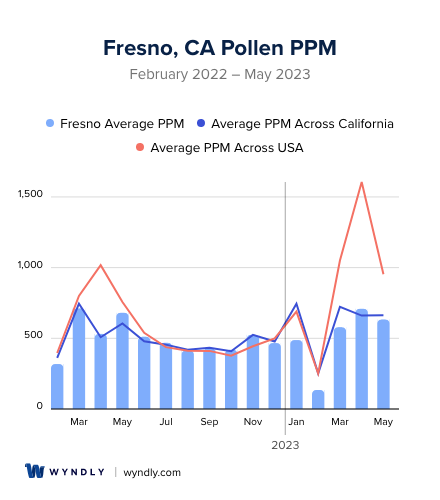
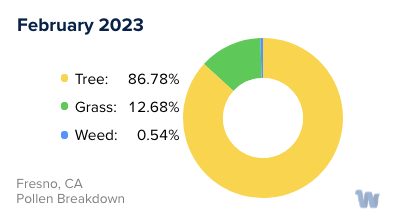
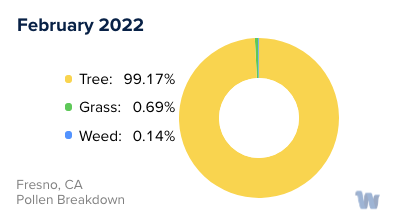
When is pollen lowest in Fresno, CA?
February
Lowest month total PPM
Avg. PPM
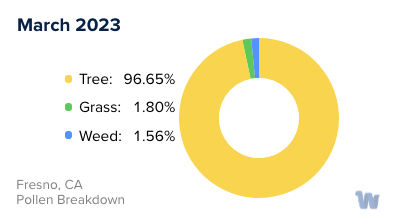
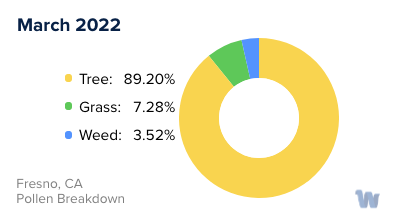
When is pollen highest in Fresno, CA?
March
Highest month total PPM
Avg. PPM
How does pollen in Fresno, CA compare to California?
Fresno has a lower average PPM than the state of California.
Fresno yearly avg PPM:
California yearly avg PPM:
How does pollen in Fresno, CA compare to the USA?
Fresno has a lower average PPM than the USA.
Fresno yearly avg PPM:
USA yearly avg PPM:
Is pollen worse this year in Fresno, CA?
Spring 2023 was about the same as 2022.
Spring 2023 PPM:
Spring 2022 PPM:
Average PPM in Fresno, CA
Fresno, CA Pollen and Allergy Breakdown by Month
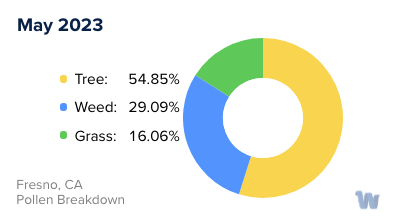
Grass
When is grass pollen highest in Fresno, CA?
May has the highest grass pollen in Fresno, CA with an average PPM of
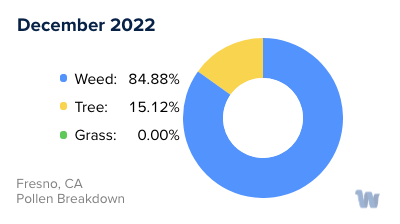
When is grass pollen lowest in Fresno, CA?
December has the lowest grass pollen in Fresno, CA with an average PPM of
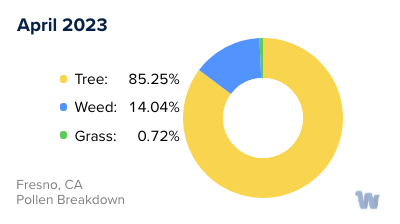
Tree
When is tree pollen highest in Fresno, CA?
March has the highest tree pollen in Fresno, CA with an average PPM of
When is tree pollen lowest in Fresno, CA?
August has the lowest tree pollen in Fresno, CA with an average PPM of
Weed
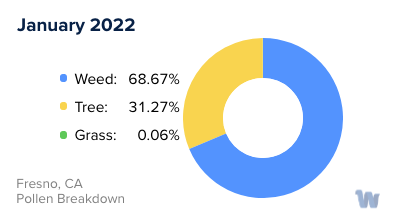
When is weed pollen highest in Fresno, CA?
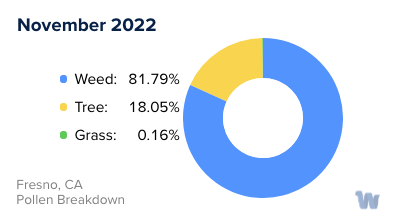
November has the highest weed pollen in Fresno, CA with an average PPM of
When is weed pollen lowest in Fresno, CA?
February has the lowest weed pollen in Fresno, CA with an average PPM of
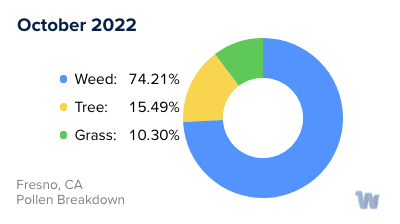
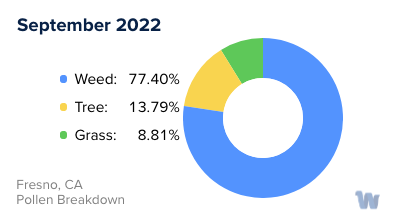
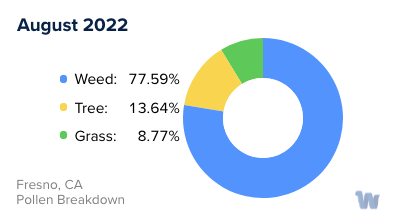
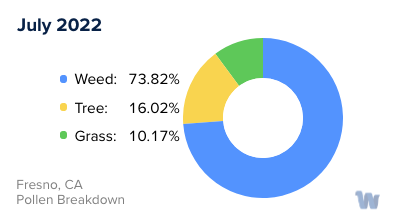
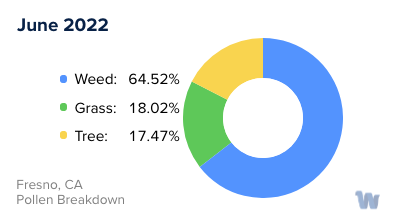
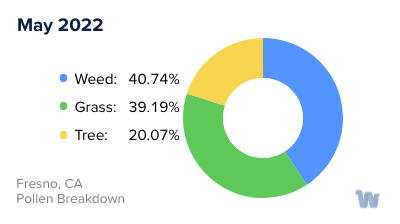
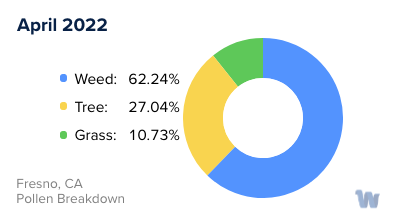
Fresno, CA Pollen Monthly Breakdown by Pollen Type
Pollen and Hay Fever in Fresno, CA
Living in the heart of the San Joaquin Valley, residents of Fresno, California, are no strangers to the pervasive pollen that permeates the air during certain seasons of the year. Pollen allergies, commonly known as hay fever, can significantly affect the quality of life for those susceptible to their effects.
Pollen is a microscopic substance that flowers, trees, grasses, and weeds release into the air to fertilize other plants. When individuals sensitive to pollen inhale these tiny particles, their immune system may overreact, resulting in the sneezing, runny nose, and itchy eyes typical of hay fever.
Fresno's diverse flora contributes various types of pollen across different seasons. In spring, the city sees a surge in tree pollen, with oak, pine, and cedar being the primary culprits. As the season changes, the pollen shifts as well, with grass pollen becoming more prevalent in late spring and early summer. Bermuda grass, Timothy grass, and Kentucky bluegrass, common in Fresno's parks and lawns, are significant contributors during this period.
In late summer and fall, weeds take center stage, releasing vast amounts of pollen into the air. Ragweed, sagebrush, and pigweed are among the most common types that can trigger hay fever symptoms in susceptible individuals.
The abundance of agricultural activities in Fresno County also plays a role in the city's pollen levels. Crops such as cotton and alfalfa can release considerable amounts of pollen, particularly during their respective blooming periods.
Fresno's weather conditions can further influence pollen levels. Windy days can stir up pollen and distribute it over a wide area, exacerbating hay fever symptoms. Conversely, rain can help wash pollen away, providing temporary relief for those with allergies.
Understanding the types of pollen and their seasons can aid individuals in managing their exposure and maintaining their well-being. While pollen allergies can be challenging, knowledge is the first step in navigating this seasonal hurdle.
